Monitoring: containers, resources and health
Monitoring, under Run, is every container of the organization in one place, in four tabs. It needs no switch: everything here comes from the state each supervisor reports on its check-in.
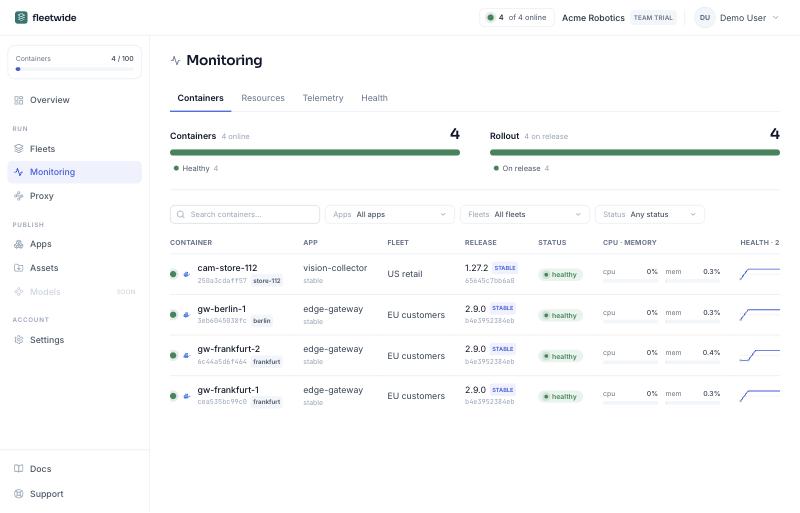
Containers is the full list, with app, fleet, release, status, CPU and memory, the last day's health and the last check-in; filter by app, fleet or status, or search. The Needs attention count on the Overview and in the header lead here.
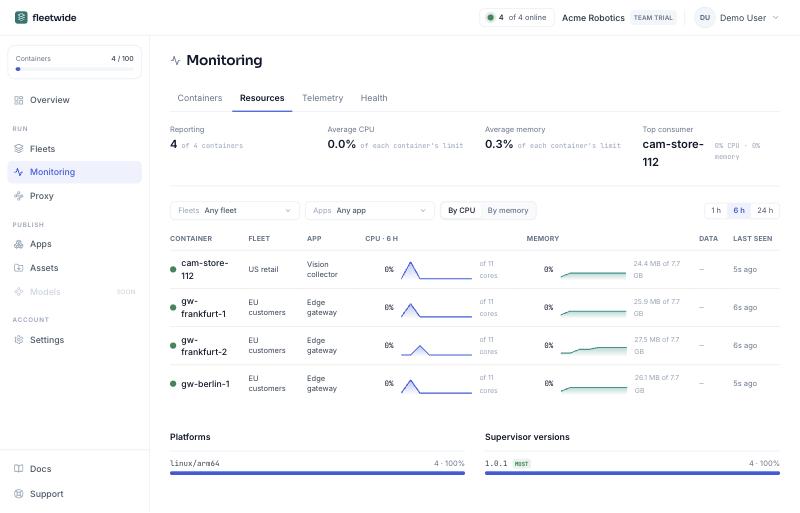
Resources is CPU and memory across the organization: how many containers report, the averages, the top consumer, and a table sorted by CPU or memory with each container's usage over the last hour, six hours or day. Platforms and supervisor versions are counted at the bottom, which is where to see which containers still run an older supervisor.
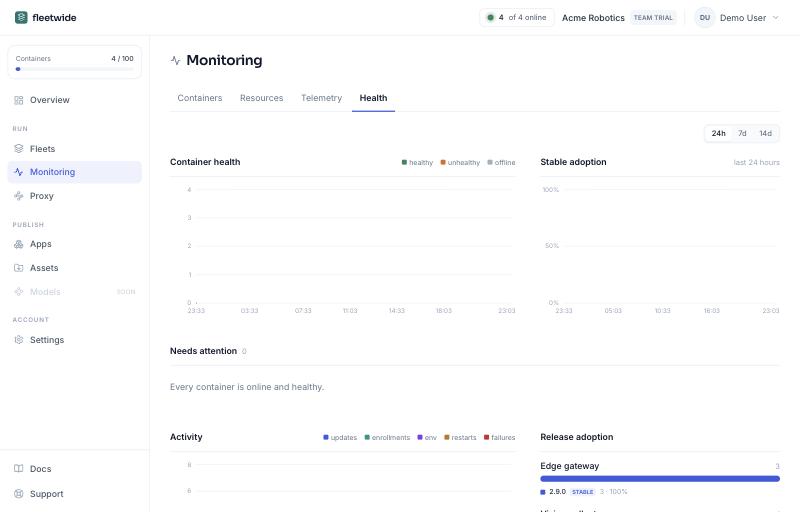
Health charts container health and stable adoption over the last day, week or two weeks, lists every container that needs attention with the reason (unhealthy, failed, exited, out of memory, rolled back, needs redeploy, offline) and since when, and carries the activity, release adoption and event timeline that used to sit on the Overview.
Telemetry is the fourth tab: the metrics your apps declare, across every fleet. See Telemetry and metrics.