Telemetry and metrics
Every check-in carries the container's state: phase, health, restarts, the last exit (code, signal, out of memory), and CPU, memory and state-volume usage read from the container's own cgroup. That needs no switch and no second process; Monitoring charts it.
With the fleet's telemetry switch on and a telemetry or developer image, the supervisor also scrapes the metrics your app declares on the app's Telemetry tab: up to four Prometheus endpoints on the container's loopback (a port, a path, /metrics by default, every 60 seconds, 15 at the least) and up to forty named gauges or counters. Only the names you declared are reported; nothing else leaves the container. A fleet's rollout conditions can halt a rollout on one.
Readings are charted on Monitoring → Telemetry for the whole organization, one dashboard per app with fleet and app filters, and on each fleet, deployment and container. Charts open on the last ten minutes, then one hour, six hours, a day or a week. A series with a single reading is drawn as a dot, so the first scrape is visible.
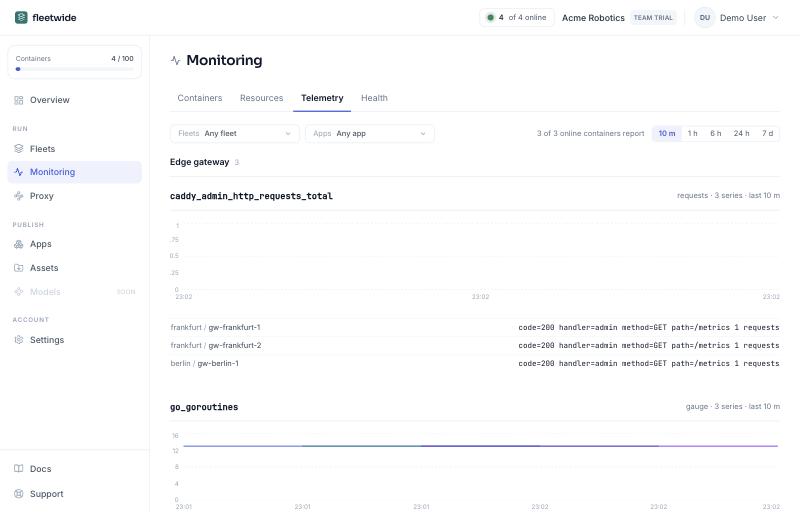
When a declared name is not in what the endpoint exposes, the supervisor says so: its log names the endpoint, how many series it found and which declared metrics are missing, and the container's Telemetry tab shows declared but not exported with the names, instead of an empty chart. Fix the declaration or the app, and the next scrape clears it.
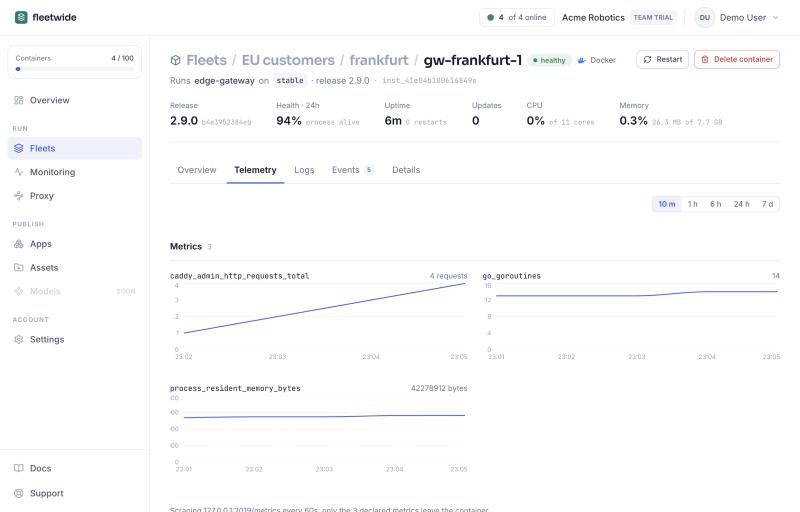
History is kept for 7-day on the Dev plan and 30-day on Team; Enterprise keeps everything. A fleet's monitoring switch (Health and metrics, in its settings) pauses metrics, health alarms and log streaming without pausing updates.